Professor Yunseok Kim’sResearch Team
Develops Method to Analyze the Component Distribution of FuelCells
-The method is expected toimprove fuel cell performance using the component distribution analyzing method
Recently, considerable attention has been focused on renewable energy due to environmental pollution problems, so polymer electrolyte* (or proton exchange) membrane fuel cells (PEMFC) that can produce electricity when fuel is supplied have been widely studied. An electrode, which is the main component of PEMFCs, consists of an ionomer (conductive polymer with ion), catalyst** that promotes a chemical reaction, and other additives. It is known that the distribution and composition of components is closely related to the performance of fuel cells.
*Electrolyte: a substance that melts into a solvent, such as water, and ionizes to have electric current
**Catalyst: a substance that promotes chemical reactions without modifying itself
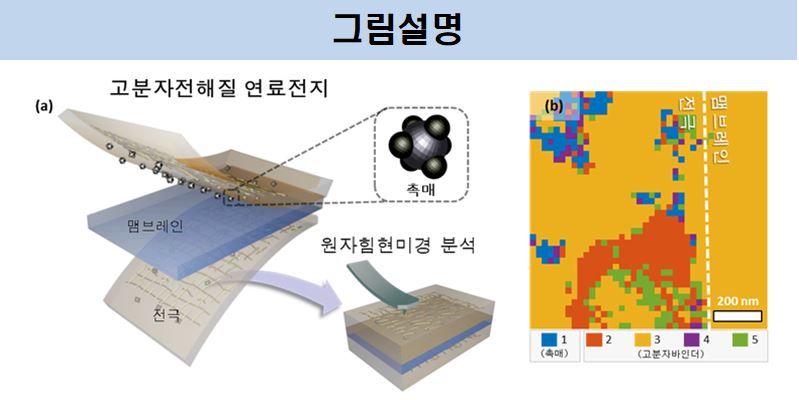
The catalyst and additives are several nanometers in diameter or in the tens-of-nanometer-scale if they are tiny. Therefore, to observe these components and analyze the distribution, usually transmission electron microscopy (TEM) is used. However, TEM can cause components to be damaged during the analysis, so only a small area can be analyzed in a vacuum environment. In other words, there were technical limitations in actual situations. To overcome these limitations, the research team led by Professor Yunseok KIM from SKKU Dep. of Advanced Materials Science and Engineering (first author Daehee Seol and co-first author Soonho Jung) worked with MEA Engineering Design TEAM, Hyundai Motor Group, and a research team led by Dr. Jae Hyuck Jang of the Korea Basic Science Institute. The team developed a methodology to analyze the component distribution of fuel cell electrodes using an AFM* and a machine learning algorithm.
*AFM (Atomic Force Microscopy): A microscope that measures the surface shape of an object to be evaluated using a tiny needle called a probe and the force between the objects being evaluated, using it to measure the properties of a substance, such as an electric current.
Based on the fact that the electrical current properties of each component may be different, the research team measured the current using an atomic force microscope and was able to evaluate the distribution of each component by applying the current value to the basic machine learning algorithm.
Prof. Kim said, “This study will help us improve the performance of fuel cells since we can analyze which type of distribution is effective in improving the performance of fuel cells. It is expected to help us apply eco-friendly fuel cells for use in automobiles in the future.”
Also, researcher Soonho JUNG added, “The application of basic machine learning algorithms made it easier to analyze the distribution of each component. If more systematic machine learning algorithms are used in the future, more accurate and effective distribution analysis would be possible”.
This work was supported byHyundai Motor Group, a National Research Foundation of Korea (NRF) grant fundedby the Korean government (MSIT) (No. NRF-2017R1A2B2003342), the Basic ScienceResearch Program through the National Research Foundation of Korea (NRF) fundedby the Ministry of Education (No. 2019R1A6A1A03033215), and the New &Renewable Energy Core Technology Program of the Korea Institute of EnergyTechnology Evaluation and Planning (KETEP, Grant No. 20173010032080).
The outcome of the research was published online on Wednesday, May 20th in Applied Materials & Interfaces, ACS (American Chemical Society), (IF 8.456).
※ Original Article: Data Mining of Heterogeneous Electrical Conduction in the Electrode Components of Fuel Cells
※ https://pubs.acs.org/doi/10.1021/acsami.0c03212
 [Image 1]
(a) Left-Schematics of polymer electrolyte (or proton exchange) membrane fuel cell (PEMFC)
Right-Schematics of analysis of the component distribution of the fuel cell by AFM (Atomic Force Microscopy)
(b) The result of analysis of the component distribution [1: When the catalyst is on the surface, 2~5: When Nafion binder is on the surface, each number is classified according to the catalyst position under the Nafion binder]
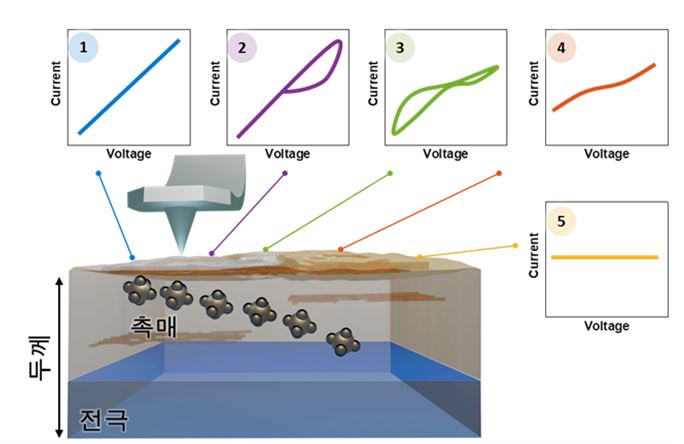 [Image 2] Schematics of current-voltage curve (I−V curve) and the catalyst position according to thickness of polymer electrolyte membrane fuel cell (PEMFC)
① When the catalyst is on the surface,②~⑤ When Nafion binder is on the surface, each number is classified according to the catalyst position under the Nafion binder